Features of Our Log Management Tool
Dashboard
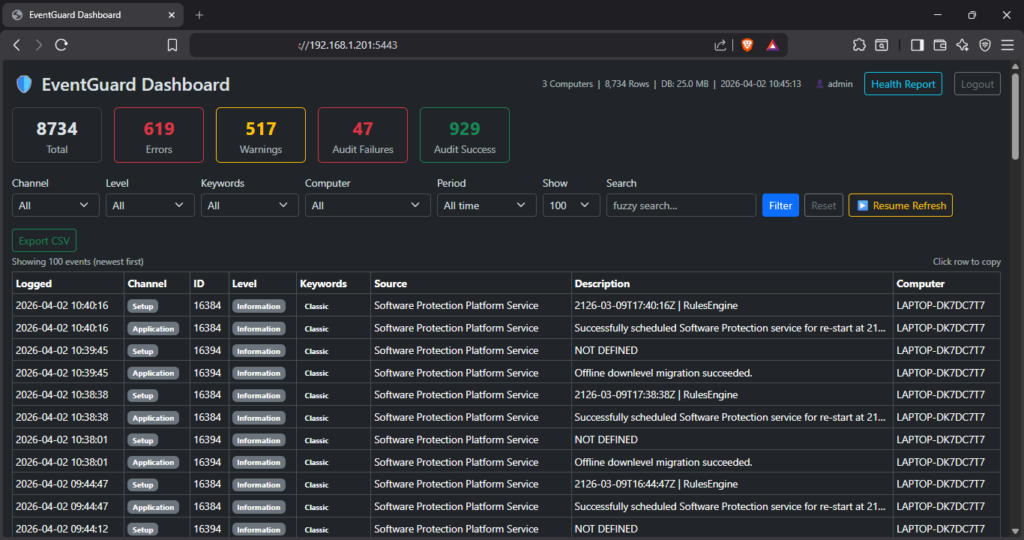
A secure HTTPS Single-Pane-of-Glass dashboard allows you to view, filter, search, monitor, and export events. Your team can access the centralized logs from a browser with security group logins and active directory as an option. Help your team respond to security incidents more quickly with effect log management. All critical event information appears in one unified interface for quick troubleshooting. Ultimately, this approach simplifies investigating and live tailing in your Windows environment.
User Interface
(Click the below picture to see a non-functional example of the dashboard)
Would instantly searching across every field decrease your MTTR?
Search across all fields including description, source, computer name, and event ID with instant highlighting of matching terms.
What if you could combine filters to zero in on exactly what you need?
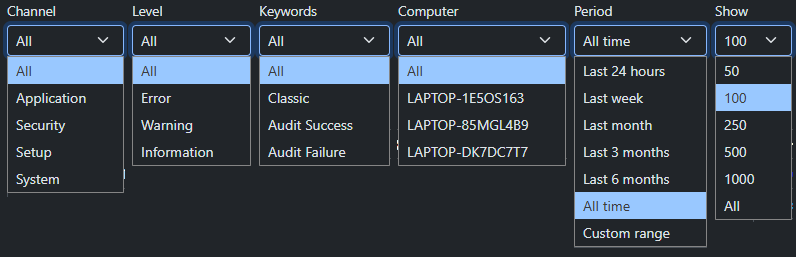
Filter by channel, severity level, keywords, time period, and number of results. Combine filters to zero in on exactly what you need.

Do you know your agent count, database size, and retention length at a glance?
Which machines in your environment are causing the most errors and warnings?
Be proactive and cleanup problem machines in your environment with our Health report.
Per-computer summary of: highlight cards for worst and quietest machines, sortable columns, and relative last-seen timestamps. One click to drill into any single machine’s events.
- Errors
- Warnings
- Audit failures
- Security events
Highlight cards for worst and quietest machines, sortable columns, and relative last-seen timestamps. One click to drill into any machine’s events.
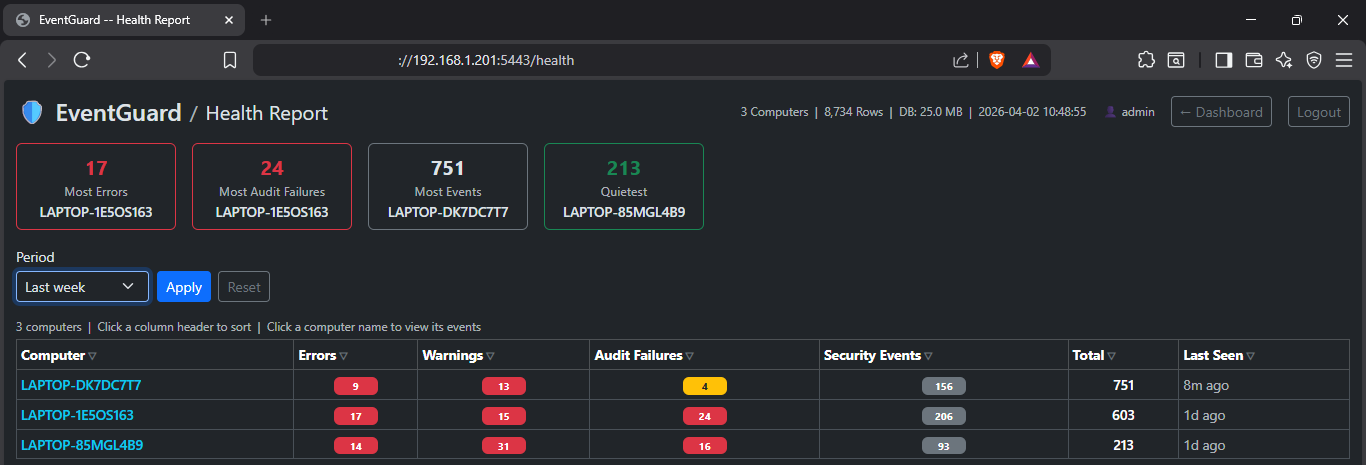
Health Report Features
Health Table – One row per computer, with the following columns:
| Column | Description |
|---|---|
| Computer | Machine hostname. Click to go back to the main dashboard filtered to that machine. |
| Errors | Events with Level = Error (any channel) |
| Warnings | Events with Level = Warning (any channel) |
| Audit Failures | Failed logons and access denied events (Keywords = Audit Failure) |
| Security Events | Total events from the Security channel |
| Total | All events from all channels |
| Last Seen | How long ago the most recent event from that machine was recorded (e.g. “4h ago”) |
The Health Report provides a per-computer summary of event activity across your environment. Click the Health Report button in the top-right corner of the dashboard to open it.
Highlight Cards
Up to four callout cards appear at the top of the page:
| Card | Shows |
|---|---|
| Most Errors | The computer with the highest error count in the selected period |
| Most Audit Failures | The computer with the most failed logon / access denied events |
| Most Events | The noisiest computer by total event volume |
| Quietest | The computer with the lowest total event count (shown when 2+ machines are reporting) |
Cards only appear when there is something to show. For example, Most Errors is hidden if every computer has zero errors.

Can your current log aggregator copy any event details to your clipboard with one click?
With EventGuard, click any event row to copy the full details to the clipboard in a structured, readable format ready to paste into a ticket or report.
Can your log tool export your filtered view to CSV with one click?
With EventGuard, export the current filtered view to CSV with one click for further analysis in Excel or your SIEM.


Need live tailing with auto‑refresh for your NOC or SOC displays?
Optional 60-second auto-refresh keeps the view current without manual reloading.
Monitoring
Built-in NIST SP 800-92 alert engine monitors 17 security conditions — failed logon thresholds, account changes, new services, audit log cleared, and more. Alerts write to the Windows Event Log and surface in the log management dashboard automatically within 60 seconds. All thresholds configurable on the EventGuard server in the dashboard.ini — no rebuild required.

Agent Features for Log Management
Lightweight (11mb memory) agents and no agent per-machine fees
- Agents run a silent Windows Service in the background, polling the Event Log every 60 seconds. Only new events are captured, so there are no duplicates and no performance impact.
- Industry standard SIEM noise filtering automatically excludes high volume, low signal events at the agent level before they reach the database, keeping storage lean and the dashboard focused on actionable events.
- A dynamic filter layer tracks how often each event source fires and automatically suppresses repetitive patterns. Suppression always expires so patterns are re evaluated over time, and nothing is permanently silenced.
- If the Dashboard is unreachable, events are saved to a local SQLite fallback database so nothing is lost. When the Dashboard recovers, queued events are automatically drained back in batches. Fallback data older than 7 days is purged to prevent disk growth.
EventGuard maps over 80 Windows Event IDs to plain-English descriptions. Unknown event IDs are flagged for review rather than silently dropped.
| Security — Logon Events | Successful logins, failed login attempts, account lockouts, remote desktop sessions |
| Security — Account Management | User accounts created, deleted, enabled, disabled, password changes, group membership changes |
| Security — Kerberos / Authentication | Ticket requests, pre-authentication failures, credential validation |
| Security — Policy & Privilege | Audit policy changes, privilege assignments, system time changes |
| Security — Network & Firewall | Blocked connections, firewall rule changes, network share access |
| System — Boot & Shutdown | Unexpected shutdowns, kernel power events, unclean restarts |
| System — Services | Service start/stop, service crashes, failed service starts, new services installed |
| Application | Application errors, crashes, hangs |
| Windows Update | Patches installed, update failures, download events |
Agent-Level Noise Filtering — Three Tiers
EventGuard applies three tiers of noise filtering at the agent level. All filtering happens before events leave the monitored machine — reducing database growth, network traffic, and dashboard clutter while preserving every security-relevant event. These are excellent ways to operate your log management strategy.
| Tier | Mechanism | What it does |
|---|---|---|
| Tier 1 — Whitelist | NIST SP 800-92 protected event IDs | Security-critical event IDs bypass the dynamic filter entirely — even during burst conditions. Tuned for DC and server deployment: Kerberos success events (4768/4769/4770) are moved to the blacklist due to DC volume; Kerberos failures (4771) remain fully protected. |
| Tier 2 — Static blacklist | Always-drop exclusions | High-volume, zero-security-value events dropped unconditionally — WFP traffic, Kerberos success (DC noise), DC network logons (4624 Type 3), service state changes, group membership polls, browser telemetry |
| Tier 3 — Dynamic filter | Learned per-machine patterns | Tracks frequency of each (channel, event ID, source) combination; suppresses repetitive noise automatically. Distinguishes one-time bursts (1-hour suppression) from sustained noise (4-hour suppression). Suppression always expires — nothing is permanently silenced |
Are log retention storage costs eating into your budget?
- Security critical events are always captured including failed logons (4625), Kerberos failures (4771), account lockouts (4740), audit log cleared (1102), new service installs (7045), process creation (4688), policy changes (4719), and all account management events regardless of frequency.
- Some high frequency event patterns may be automatically suppressed by the agent before they reach the dashboard. This is handled by the dynamic filter, which learns repetitive noise patterns per machine. If you notice events from a specific source are missing, contact your administrator. Suppression rules are visible in learned_filters.json on the agent machine and can be reset by deleting that file and restarting the service.
Event Database Features
- Unlimited database size — store as many events as your hardware supports
- Data retention is 13 months with events older than that automatically purged daily in accordance with NIST SP 800-92 compliance
- All events are stored in a secured PostgreSQL database on the server the Dashboard is deployed to for log management
- Agents send events encrypted with SSL/TLS via HTTPS to the database. No database credentials are needed on agent machines
EventGuard Requirements
| Software dependencies | PostgreSQL only as Dashboard runs on fully self-contained executables |
| Browser support | Any modern browser — Chrome, Edge, Firefox |
| Operating system | Windows 10, Windows 11, Windows Server 2016+ |
| CPU/RAM | If it runs Windows it is sufficient |
| Disk space | Depends on event volume. Allow at least 10 GB for the database. |
| Database | PostgreSQL (free, open source) on the Dashboard server or local network |
| Firewall | TCP port 5443 open for inbound HTTPS connections from agents and browsers |
Memory Used
| Dashboard | 10-50mb |
| Agent | 11mb (significantly less than the competition of upwards of 1gb) |
EventGuard is the log management tool you have been waiting for.
Simple interface. Flat rate pricing. EventGuard makes Windows log management effortless.